 |
| Figure 1. Can you guess what music is this? Clue: food! |
I won't be naming this score sheet at the moment. I got this score sheet from www.flutetunes.com. For now, I'll discuss how to process this image in a way that the computer will be able to read each note, and hopefully with the corresponding duration of the tone. I selected this piece because first this is a Filipino song (another clue!) and second is that this is in C major, which reduces the complexity of processing the score sheet. The problem with those in other majors is that the natural symbol is often added at certain notes to remove the flat or sharp. Also, I chose this music because there are no rests, which have a lot of varieties in appearances, depending on the duration of the rest. To further simplify the activity, I removed the clef and the time signature:
 |
| Figure 2. Same score sheet but with fewer symbols. |
First, I try to locate the position of the staves:
 |
| Figure 3. Plot of the line scan at the 531th column. This column was chosen because there will be no intersection with other symbols along the scan. |
 |
| Figure 4. Plot of the line scan at the 531th column. Similar to the previous, but scaling was performed to make it look better. |
Now that we have the locations of each line for all the staves. we use them to approximate the position of the notes. But we'll leave that aside.
To simulate the music from the score sheet, we need to determine not only the note but also the duration of the tone. In the score sheet above, there are half notes, quarter notes, and one-eight notes. Also, there are dotted notes, with the dot indicating a duration for the note that is 1.5 times the original duration of the note.
I was able to differentiate the half notes and quarter notes using edge detection and template matching. I selected the round part of a quarter note and obtained its negative, then performed edge detection.
 |
| Figure 5. Left: original "note", center: negative of the previous. right: image for template matching. |
I also obtained the negative of the score sheet:
 |
| Figure 6. Negative of the image in Figure 2. |
 |
| Figure 7. Result of template matching and thresholding. |
HMMM. For now i'll be neglecting the difference between the quarter note and one-eight note, as well as the dot. If time permits, I'll be working on these things.
After much deliberation on how to trace the notes that belong to the same staff, I've become successful! Yeah!
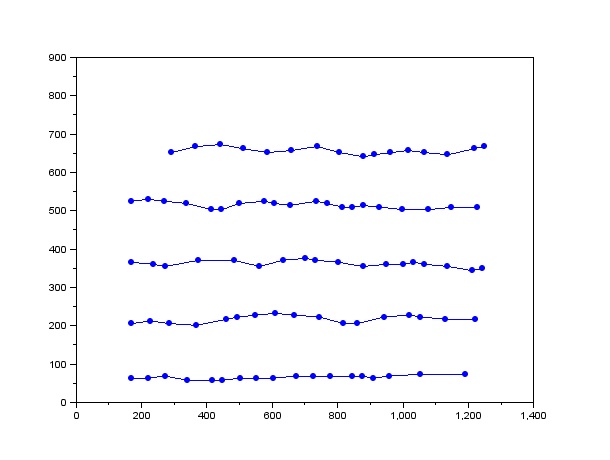 |
| Figure 8. Location of the centroid of the notes. The lines connecting the dots indicate that they are on the same staff. |
 |
| Figure 9. Separation of the staves. |
At the moment, I'm already able to tell which line or space does one note fall on. To know the duration of the note, I used a threshold value different from Figure 7:
 |
| Figure 10. Different thresholding |
 |
| Figure 11. Area measurement of each blob. |
So here it is, the plot of the locations of the centroid on the image, with the red stars representing the half notes and the blue dots representing the quarter notes and one-eight notes:
 |
| Figure 12. Location of the notes on the image. Red stars: half notes; blue dots: quarter notes and one-eight notes |
After three days, Scilab was able to finish performing the song. YES THREE DAYS. I don't know why it took Scilab that long. Maybe I should have deleted the other variables to empty up the memory of the computer. And because of that I was not able to do my other blog activities. Oh well, have fun listening to the song!
For this activity, I would give myself a grade of 12/10 because I used different techniques:
- edge detection - which is actually a weird but novel approach, i think. this is to pick up only the notes
- template matching - locate the notes based on the reconstructed edge of the note
- blob analysis - finding the centroid of the notes
- morphological operations - determine the duration of the note. analysis of the size allowed me to determine which are the half notes and which are different
- this one is actually not a technique, but it was fun doing the activity by analyzing the entire image, and not by first dissecting it to different staves. what's cool about this is that the program then analyzes the score sheet from the first measure through the final measure, all found on the same image.
And I'm also proud of my work since I did this for two agonizing weeks. Plus the song is very...nationalistic? hahaha. :)
References:
1. A12 - Playing notes by image processing. M. Soriano. 2013.
No comments :
Post a Comment